|
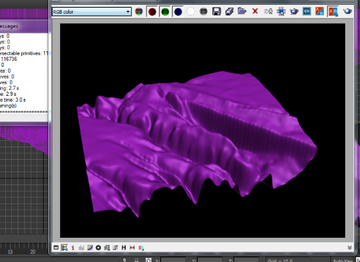
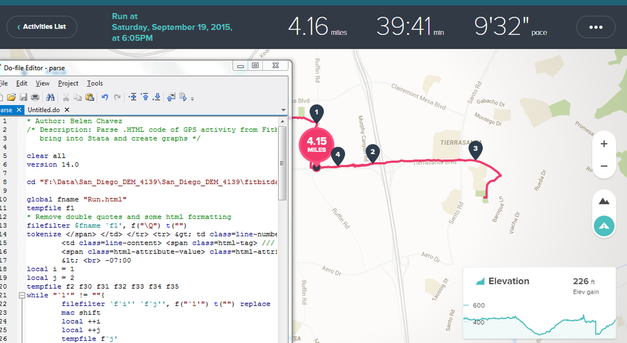
Some of the best ideas are those that happen right outside of your comfort zone. Unfortunately, they can also lie outside of your current means as well. Not to worry though, because with a little luck and a lot of perseverance, we can eventually erode away at the mountainous tasks that lie ahead. Like a running stream we can… well, perhaps that’s quite enough nature metaphors, but I think you get the picture. I’m personally extremely excited to reveal this next set of blog posts because it ties together so many different concepts. This means that it will be broken out into several different parts. However, the complexity also comes at a cost. I thought I would be done by now – the struggle is real! While I continue to do my research, I’ve added a quick snippet of what’s to be expected: Alright, so it’s not that exciting. Yet. Remember what I said about current means? 3D rendering takes quite a long time, and my current computer can’t handle it that well which means I’ll be upgrading (or borrowing) resources. I’d like to point out the silver lining within this video though – this is actual data for elevation and location. Stata wrote this. Stata also wrote these mountains below. With some help from an excellent source, Stata is able to bring in Fitbit data with ease. Finally, here’s a panorama picture from inside my pocket. It plays a big role in the posts to come... Stay tuned!
1 Comment
Did you know that Mata has a hidden command called numtobase26? Given its usefulness with putexcel, I can’t possibly see why it’s hidden! Perhaps Stata doesn’t want us using their highly-tuned statistical analysis software as a glorified spreadsheet beautifier. Nevertheless, you may be forced to automate a god-awful excel report in order to free up time to utilize Stata to the fullest!
This is where we start to depart from our beloved putexcel, and shift slightly towards xl(). Both commands tend to serve the same purpose, but much like Stata vs. Mata, putexcel is meant for the layman, and Mata is meant to make things fast while being slightly less readable. Gross oversimplification aside, putexcel favors the traditional spreadsheet alphabetical columns names combined with row numbers A1, A2, A3 whereas xl() generally takes the r1, c1 form. Say you have a dataset with 50 variables: v1, v2, v3, …, v50 and you wish to rename the variables so that they match the rows of excel. We could try and loop through the alphabet c(ALPHA), but once you get to Z, things start to get tricky. For me, a much simpler solution is to use numtobase26. For those unfamiliar with Mata, you can make a vector of sequential numbers with ease: mata: (1..50)
We have a row vector with 50 elements that we can now convert to our excel column names using:
mata: numtobase26((1..50)) A B C D E F G H I J K L M N O P Q R S T U V W X Y Z AA AB AC AD AE AF AG AH AI AJ AK AL AM AN AO AP AQ AR AS AT AU AV AW AX
We just need to store it as a local so we can use it easily in Stata. (Also concatenate the elements)
mata: st_local("alphavars", invtokens(numtobase26(1..50)))
ren * (`alphavars'), dry
You can imagine how this can greatly simplify creating putexcel functions that require you to reference columns by their excel name using a simple foreach var of varlist * combined with the levelsof technique described in Part I. Codebook
What happens if you want to go the other way? Say you have the column BC12 but you wish to convert this to 55, 12 so you can use it in one if xl()’s many functions. Unfortunately, I could not find an easy solution, so I made a rough fix that should be similar to how putexcel handles its cell expressions. Feel free to use the numofbase26() Mata function if you ever find yourself in this predicament.
real matrix numofbase26(string matrix base)
{
    real matrix output, pwr, b
    real scalar i, j, k, l

    base = strupper(base)
    output = J(rows(base), cols(base), .)

    for (i=1; i<=rows(base); i++) {
        for (j=1; j<=cols(base); j++) {
            if (strlen(base[i,j]) == 1) output[i,j] = ascii(base[i,j]) - 64
            else {
                l = strlen(base[i,j])
                b = pwr = J(1, l, .)
                for (k=1; k<=l; k++) {
                    b[1,k] = ascii(substr(base[i,j], k, 1)) - 64
                    pwr[1, k] = l - k
                }
                output[i,j] = rowsum(b :* (26:^pwr))
            }
        }
    }
    return(output)
}
Happy Automating! I promise the next post will contain less technical stuff and more pictures.
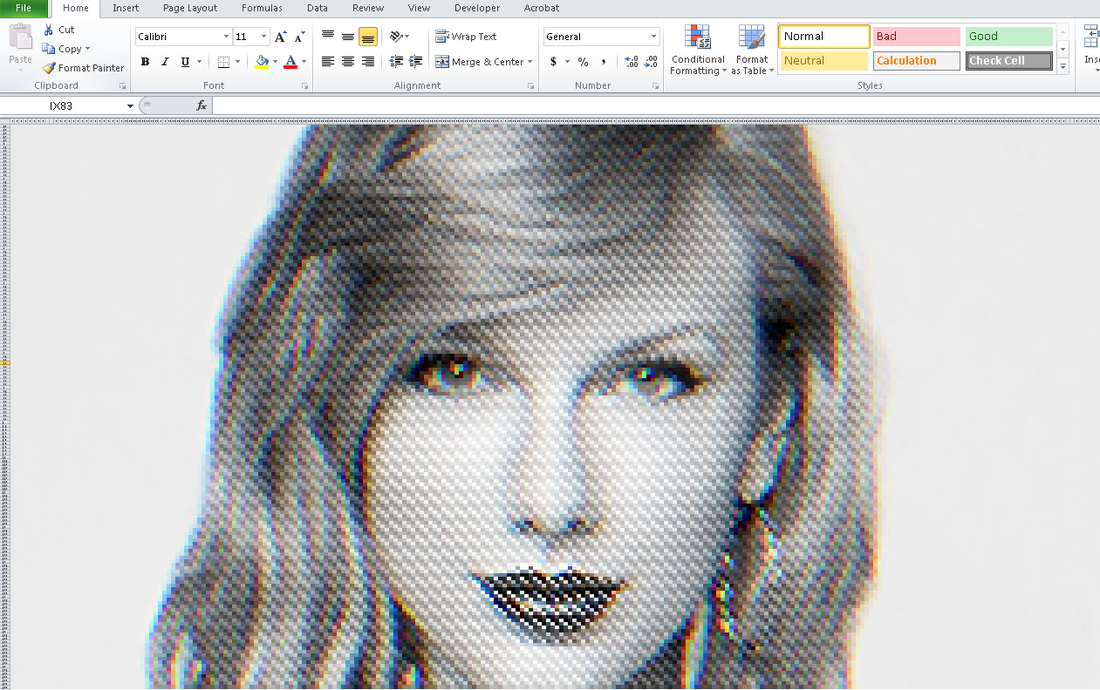
Check it: Excel Art.
Stata 14 – a cause for fanfare – expanded Stata’s abilities to format excel files. Sounds exciting right? You’re damn right. Excel files no longer have to be pre-templated before the dreaded export excel messes up your number formatting. Putexcel used to alleviate this problem in Stata 13, but only for numeric matrices. Luckily for us those days are long lived but long gone, and putexcel evolved into a very useful command.
So what’s the first step in creating this captivating art? Finding an easily parsable file format of course. The EPS (Encapsulated PostScript) format does just that – take a look for yourself: EBEBEBEBEBEBEBEBEBEBEBEBEBEBEBEBEBEAEAEAEBEBEBEBEBEBEBEBEBEBEBEB EAEAEBEBEBEBEAEAEBEBEBEBEBEBEBEBEBEBEAEAEBEBEBEBEBEBEBEBEBEBEBEB EAE4E7E5E3DECFB292948D97A29D9F9D9FA9A6A49477726A5D4F484A4742484B 453B36302E2C302E2F3735332C2B32322C2D393C423E3738404950575E5F605B 545D655D5E5C5E6C6972767D888D9DA9B4B9BAC1B7ADA19995907A66646E6C7C 9099B7A99F9E9CADAB97838FB1CDE1E9ECEBEBEBEBEBEBEBEBEBEBEBEBEBEBEB EBEBEAEAEBEBEBEBEBEBEBEBEBEBEBEBEBEBEBEBEBEBEBEBEBEBEBEBEBEBEBEB EAEAEBEBEAEAEAEAEAEAEAEAEAEAEAEAEAEAEAEAEAEAEAEAEAEAEBEBEBEBEBEBThere’s no binary, just text. And while it may look like the transcript of a sugared-out toddler, it contains a lot of good color information. The first thing to know is that all colors we deal with are related to light. The three additive primary colors are red, green, and blue. If you ever looked closely at an old TV screen (like I did as a young’un), you’d see these three distinct colors. In this case, each color uses 8 bits: 2*2*2*2*2*2*2*2 = 256 possible combinations per color. Each color then gets a number from 0-255. Zero means the color is off while 255 corresponds with a full-on color! So RED in RGB mode would look like this: “255 0 0”. Converting this number to base 16 yields “FF 00 00” or “FF0000” without spaces. Going backwards: “EAE4E7” is the same as “EA E4 E7” which converts to “234 228 231” in base 10. This is made easy with Mata’s frombase command. After a few tricks - such as finding the right order of the data stored - we’re able to convert the previous gibberish to pixel information/excel cell information. This is where putexcel gets good. The matrix of color information is passed to a Stata dataset so that it utilizes the fpattern cell expression of putexcel. An example Stata variable would look like this: V1 A1=fpattern(“solid”, “234 243 243”) A2=fpattern(“solid”, “234 243 243”) A3=fpattern(“solid”, “234 243 243”) Because we have a column of strings we can use the levelsof command to create a list containing each of these expressions and write them directly using the putexcel command. Now we’re ready to shake shake shake out that final command:
foreach v of varlist * {
        levelsof(`v'), local(`v') clean
        local cellexp = "`v' `cellexp'"
}

local cellexp = subinstr("`cellexp'", " ", "' ", .)
local cellexp = subinstr("`cellexp'", "v", "`v", .)
putexcel `cellexp' using "Art.xlsx", sheet("LoveStory") replace
The trick here is using the option "clean" in our levelsof command to strip all the double quotes so that we can use it directly in our putexcel statement. While we could have included the putexcel statement within the loop, the advantage here is that, because we’re only calling the command once, we don’t have to continually open and close the excel file for each putexcel statement - making it run in seconds. Now we’re ready to find our Starbucks lovers, get in fights at 2:30 am, and never ever get back together because we just saved ourselves so much time! Can you spot all the Taylor Swift references? I count seven. |
AuthorWill Matsuoka is the creator of W=M/Stata - he likes creativity and simplicity, taking pictures of food, competition, and anything that can be analyzed. Archives
July 2016
Categories
All
|


 RSS Feed