|
Have you ever been burdened with making up data? Of course not, you say! How dare you charge me with such accusations! Well first, calm down. Sometimes it’s okay to “make up” data. For instance, for testing purposes: perhaps you have an idea of the approximate shape of the data you’ll be feeding into your program, but some lazy programmer isn’t providing you with the necessary steps to proceed. You could create a sinusoidal function to create an approximate representation, but who really has the time for that. The solution lies with a 3rd grader’s doodle.
Balderdash! But really, it’s much easier to draw out the shape of your data that to input it cell by cell or create some function that’s going to be scrapped in the end anyway. Even better, perhaps someone put this graph in a presentation, but is refusing to share their base data. No problem for us. For this tutorial, we’re going to need to download GIMP, a free graphics editing software program that’s similar to Photoshop, but also drives me crazy because it has completely different hotkeys.
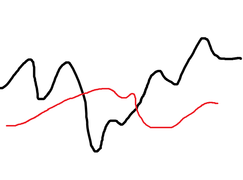
Take this image and open it in GIMP. Then make sure to save it as an HTML webpage. By selecting this option, GIMP converts every pixel to a cell in an HTML table, allowing for us to parse this information out ourselves. Remove HTML tags and only keep relevant information: each <td> tag should have a background color which is the hexadecimal RGB color of the cell. Recall that <td> tags indicate cell data whereas <tr> tags indicate a new row. Since each line contains a new bit of information, we don’t really care about the td tags. In fact, tag the <tr> tags (gen trtag = regexm(lower(v1), “<tr”), and take the running sum of that variable (replace trtag = sum(trtag)). This way, we have a corresponding row to each point of data. Create a running count variable by each row - this will give us column positions. Create a variable that’s equal to our column position gen black = run_count if y == "000000" gen red = run_count if y == "ed1c24"
Finally, collapse your black and red variables by your column variable: collapse black red, by(colpos) fast To make everything look nicer, I used the lowess command to smooth out my lines, but you don't have to if you're looking to get extremely accurate data. lowess black s, bwidth(.08) gen(bsmooth) lowess red s, bwidth(.08) gen(rsmooth)
* s represents our row count variable (trtag)
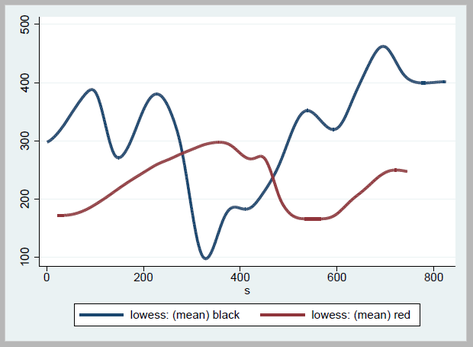
Finally resulting in: line *smooth s, lwidth(thick thick)
which gives us the following output in Stata:
PLEASE NOTE: Stealing graphs and making up data are bad practices. I wouldn't actually do this in the professional setting. This post merely serves to show how this process may be done.
2 Comments
5/6/2022 06:09:26 am
nks for sharing the article, and more importantly, your personal experience mindfully using our emotions as data about our inner state and knowing when it’s better to de-escalate by taking a time out are great tools. Appreciate you reading and sharing your story since I can certainly relate and I think others can to Leave a Reply. |
AuthorWill Matsuoka is the creator of W=M/Stata - he likes creativity and simplicity, taking pictures of food, competition, and anything that can be analyzed. Archives
July 2016
Categories
All
|
 RSS Feed